Elliott Wave Theory | Technical Analysis Strategy
Elliott Wave Theory is based on an analysis of 75 years of stock price movements and charts by RN Elliott (Read more about him here https://en.wikipedia.org/wiki/Ralph_Nelson_Elliott ). Elliott Wave Theory suggests that movements of the market follow a sequence of crowd psychology cycles. With the help of this Elliott wave theory, traders can forecast market trends by identifying extremes in prices and investor psychology.
What is Elliott Wave Theory?
The Elliott Wave Theory is a technical analysis technique developed by American accountant and author Ralph Nelson Elliott in the 1930s. The Elliott Wave Theory suggests that stock price movements can be reasonably predicted by studying price history as the markets move in wave-like patterns driven by investor sentiment. Like ocean waves, the movements are repetitive, rhythmic, and timely.
Motive and Corrective Waves
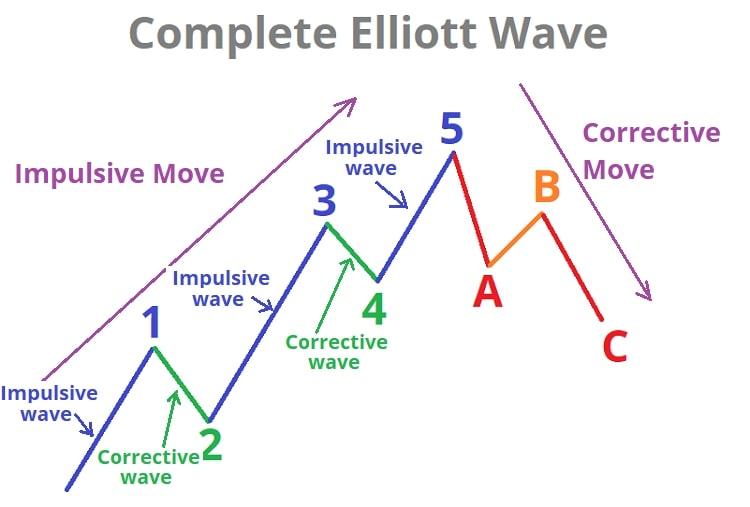
Elliott’s Wave Theory mainly comprises two kinds of waves – motive (impulse waves) and corrective waves. Motive waves are movements that occur in the direction of a trend. On the other hand, corrective waves occur in a direction opposite to the ongoing trend.

Let’s assume that we are in a bull market. One motive waves trend comprises five waves – 1, 2, 3, 4, and 5. Waves 1, 3, and 5 are impulsive in nature as they move the stock price in a particular direction (here, upwards ). Wave 2 is a smaller downward movement after wave 1, and wave 4 is a smaller downward movement after wave 3. On the other hand, retrace waves (2 and 4) are broken up into upward and downward movements of three waves. Again, One corrective waves trend comprises three waves – A, B and C. In a bull market, a motive waves trend takes the stock price upwards, while a corrective waves trend reverses the price trend. In a bear market, a motive wave would take the stock price down, and a corrective wave will take the stock price up. Therefore, in a bear market, the Elliott waves diagram shown above will be inverted. It will consist of five waves (1, 2, 3, 4, and 5) taking the price down and three waves (A, B, and C) taking the price up.
Rules of Elliot Wave Theory

There are three main rules to the Elliot Wave theory that analysts must know. These rules apply only to the impulse phase
- First rule: Wave 2 cannot retrace more than 100% of Wave 1
- Second rule: Wave 3 cannot be the shortest among waves 1, 3, and 5
- Third rule: Waves 1 and Wave 4 must not overlap
The key to using the Elliot wave successfully lies in counting the waves correctly and identifying the wave in which the market is currently trading in. It will certainly take few hours of practice to understand how to make use of Elliott Wave Theory patterns, but if you remember the rules, the process of predicting market swings can become a little easier.
How to use Elliot Wave Theory in Trading

In the Elliott’s Wave Strategy (EWS), the key idea is to understand the market psychology which indicates the swing between optimistic and pessimistic modes. At times, the market instruments will be bullish and, at times, they will be bearish. The basic principle of the Elliott Wave Theory is that over a certain period of time, prices move in certain patterns.
There are different methods traders can use to start an Elliott Wave count. However, the best method to start an Elliott Wave count is to begin the count at an extreme swing high or an extreme swing low. Also, if you want to find the Elliott Wave cycles of higher degree you need to start counting the waves from the weekly and monthly charts. We can then break any price trend movement into this basic 5 – 3 wave pattern and identify where Price trend is likely going to change. This is what makes the Elliott Wave theory so appealing to traders as it provides them with a method to spot precise price points where the market is likely to reverse.
Final Takeaways
Elliott Wave theory is one of the most acknowledged and widely used forms of technical analysis. However, the Elliott Wave should not be considered as a technical indicator but a theory that helps in predicting the behavior of the market. As we have discussed above Elliott wave theory is open to interpretations in different ways by different traders, so are their patterns. Waves should always be used in combination with other types of analysis, including economic news and technical indicators that may affirm or dispute the suggestions of the Elliott Wave Theory. Popular indicators used in conjunction with the Elliott Wave Theory include RSI, SMA & MACD.
Disclaimer:
The information provided herein is for general informational and educational purposes only. It is not intended and should not be construed to constitute advice. If such information is acted upon by you then this should be solely at your discretion .
Read more : Bullish Bearish Engulfing Pattern | Intraday Strategy 1 (https://thebrightdelights.com/bullish-bearish-engulfing-pattern-intraday-strategy-1/ )
