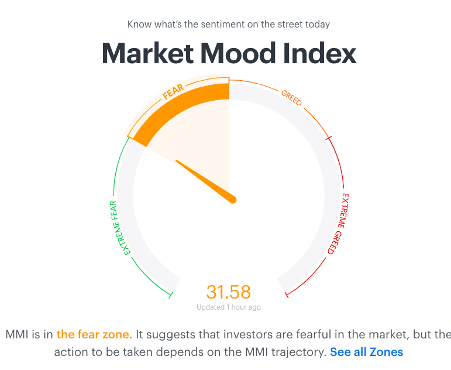
Market Mood Index
The Market Mood Index is a real-time share market indicator that describes the current mood of the market.
Investors typically describe market sentiment as bearish or bullish. When bears are in control, stock prices are going down. When bulls are in control, stock prices are going up. In broad terms, rising prices indicate bullish market sentiment, while falling prices indicate bearish market sentiment. Emotion often drives the stock market, so market sentiment is not always synonymous with fundamental value. That is, market sentiment is about feelings and emotion, whereas fundamental value is about business performance. In broad terms, rising prices indicate bullish market sentiment, while falling prices indicate bearish market sentiment.
Market Mood Index : Underlying factors
The Market Mood Index takes into account 3 important factors to give a complete picture of emotions driving the market.
1.Momentum : For the stock markets, momentum signifies a company’s stock price going up from where it currently is. When a lot of companies have such momentum, the broader stock markets are also said to have momentum.
For the stock markets, momentum can be positive or negative. The market can move in either direction with speed. Positive momentum depicts bull markets, whereas the markets would have negative momentum in bear phases.
2.Volatility and Skew : In India, one of the ways of measuring stock market volatility is by using an index called India VIX. This is a volatility index based on Nifty index option prices. According to the official NSE website, India VIX calculates a volatility figure in percentage terms from the best bid-ask prices of Nifty Options contracts. The index indicates the expected market volatility over the coming 30 calendar days. A high index value indicates higher volatility. In the context of the stock markets, skew tells us the direction in which the market is expected to move. Skew is typically used along with the VIX index, which is a depiction of the volatility that is expected in the stock markets. The VIX index tells us how volatile the markets can be and skew tells us the direction in which the markets could go.
3.Price Strength : The higher the price-strength the more positive and bullish the market is, while a negative and falling price-strength indicates the market is bearish in its outlook. The total number of stocks that have hit their 52-week high is divided by the total number of stocks to calculate the % of stocks near their 52-week high. Similarly, the % of stocks near their 52-week low is calculated. The latter is then subtracted from the former to give us the price strength of the market.
Considering above three factors along with FII Activity, Market Breadth & Demand for Gold, Market researchers make Market Mood Index . The final indicator value is calculated by giving equal weight to each of the components.
Be fearful when others are greedy & greedy when others are fearful
– Warren Buffett
Final Takeaways
MMI is a sentiment index and investors shouldn’t take buy/sell decisions, just based on the current value. But once an investor has decided to invest or close existing positions, the MMI can help them better time the market.
Read more : 52 week Low/High : Delivery trading Strategy 1 (https://thebrightdelights.com/long-term-stock-selection-strategy-52-week-low-high/ )